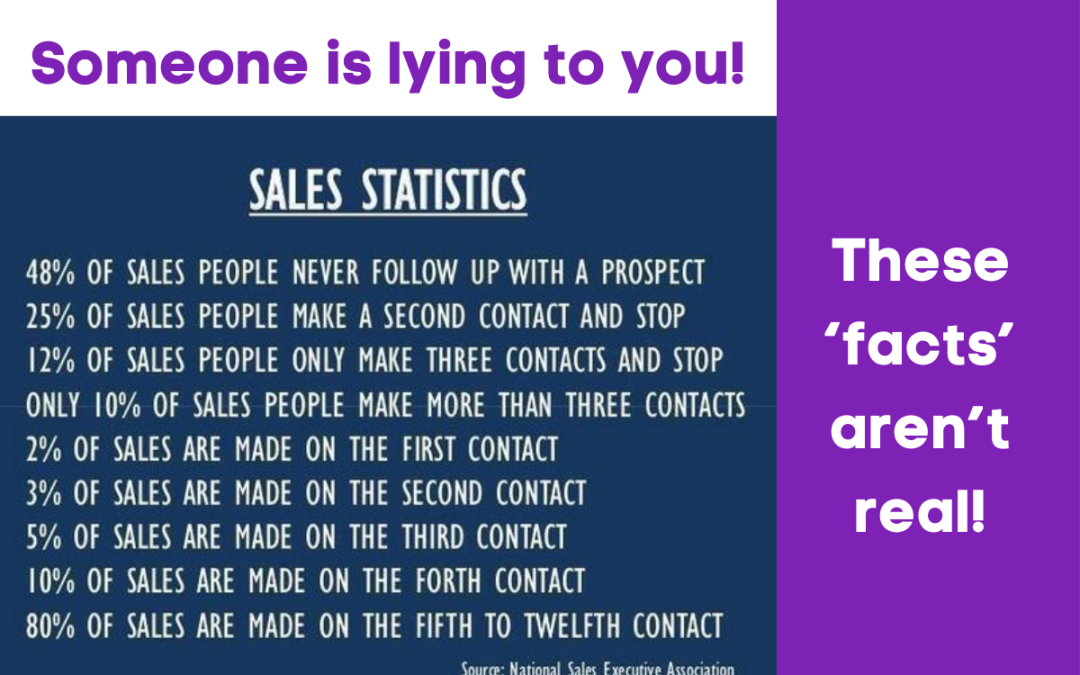
Have you seen these powerful sales statistics before or shared them with your team?
Now, did you believe it, because someone might have been fooling you?
Well, it does look credible, but in fact, these statistics from The National Sales Executive Association aren’t what they seem….
Primarily because there is no such organisation! Google it! Nothing, nada, zilch.
But yet these statistics are widely touted as being sales gospel. Why is that do you think?
Well maybe there is a lack of other data?
Maybe there are elements of truth?
Who knows?
So my view is this, have a look at this and work out the potential lessons for your own team – this wrong infographic could actually be a great learning tool!
For example, ask them these questions:
❓ “Do you think this is accurate?”
❓ “How many follow ups do you tend to make?”
❓ “How many outreaches do you make before a customer buys?”
❓ “What other factors come into play to get a sale?”
Now suddenly, this piece of wrong data could be a great way to have a meaningful training conversation with your people!
Give it a try.
Happy selling!
07748 994 334
jefere@tadpoletraining.com

